

XIRR vs CAGR is the question behind most confusing return figures in a mutual fund statement. Both are yearly rates. However, they answer different questions, so using the wrong one can make a healthy SIP look weak, or a weak one look healthy.
This guide explains how each figure is worked out, walks through a SIP example with real numbers, and shows when to rely on which. It also covers the common mistakes people make when they compare the two.
XIRR vs CAGR: the short answer
CAGR is the steady yearly rate that turns one starting amount into one ending amount. XIRR is the yearly rate that fits a whole series of cash flows, each on its own date.
So, for a single lump sum that you leave untouched, both give the same number. For a SIP, a top-up or a partial withdrawal, however, only XIRR gives a fair answer. That is the whole difference in one line.
What CAGR measures
CAGR stands for compound annual growth rate. The formula is simple: CAGR = (ending value ÷ starting value)1 ÷ years − 1.
For example, say ₹1,00,000 grows to ₹1,61,051 over five years. The CAGR is 10% a year. In other words, CAGR smooths a bumpy ride into one steady rate, even though the actual yearly returns went up and down along the way.
Fund factsheets use the same logic for their trailing one, three and five-year returns. They assume a single investment on the start date and measure it to the end date. That is fine for comparing funds. It is not, however, a measure of what your own SIP earned.
What XIRR measures
XIRR stands for extended internal rate of return. It treats every purchase as money going out and the current value, or any redemption, as money coming in. Each flow keeps its own date. The calculation then finds the one yearly rate at which all those flows balance out to zero.
Because each instalment is weighed for its own holding period, an instalment made last month barely moves the result. By contrast, one made three years ago counts in full. This is exactly how a SIP works in real life, which is why XIRR suits it.
How XIRR vs CAGR works in practice: a SIP example
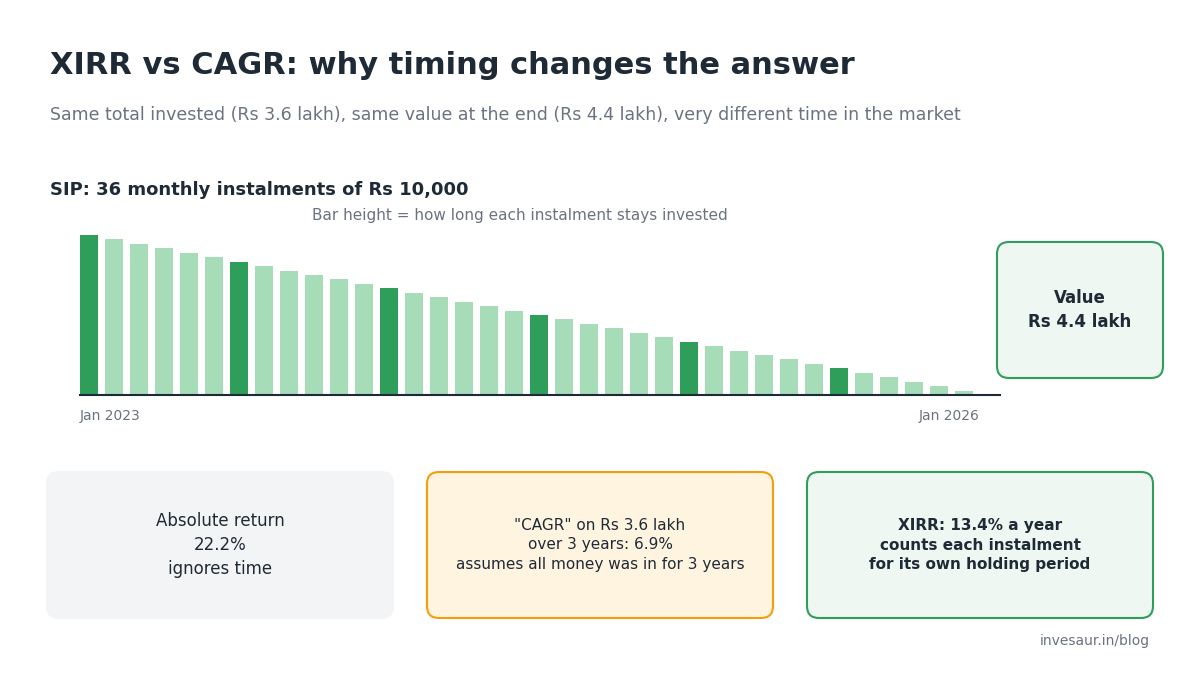
Suppose you invested ₹10,000 on the 5th of every month from January 2023 to December 2025. That is 36 instalments, or ₹3,60,000 in total. On 5 January 2026, the holding is worth ₹4,40,000.
| Measure | How it is calculated | Result |
|---|---|---|
| Absolute return | (₹4,40,000 − ₹3,60,000) ÷ ₹3,60,000 | 22.2% in total |
| “CAGR” on the total invested | (₹4,40,000 ÷ ₹3,60,000)1/3 − 1 | 6.9% a year |
| XIRR | Solves for one rate across all 37 dated cash flows | About 13.4% a year |
The CAGR shortcut is wrong here because it assumes the full ₹3,60,000 went in on day one. In reality, the average rupee was invested for only about a year and a half. XIRR accounts for that, so it reports a much higher and accurate yearly rate.
To check this yourself in Excel or Google Sheets, put the dates in one column and the amounts in the next. Enter each instalment as a negative number and the current value as a positive number on today’s date. Then use the formula =XIRR(amounts, dates). Microsoft’s guide to the XIRR function explains the inputs in detail.
XIRR vs CAGR compared with other return measures
| Measure | Best for | Counts the timing of each flow? | Main limitation |
|---|---|---|---|
| Absolute return | Holdings under a year | No | Ignores how long the money was invested |
| CAGR | One lump sum with no later flows | Only the start and end | Misleads for SIPs and top-ups |
| XIRR | SIPs, top-ups, withdrawals, whole portfolios | Yes, every flow | Swings a lot over very short periods |
| Rolling returns | Judging how consistent a fund has been | Uses the fund’s history, not your flows | Describes the fund, not your own result |
Rolling returns answer yet another question: how has the fund done across many start dates, rather than just one? That makes them useful when you choose a mutual fund. XIRR, on the other hand, is the better tool for judging your own investment once you hold it.
When to use XIRR and when to use CAGR
- Use CAGR to compare trailing returns on factsheets, or to judge a single lump sum you have not added to.
- Use XIRR for any SIP, step-up SIP or portfolio with several purchases or withdrawals.
- Use XIRR when you compare a SIP with a fixed deposit or another option, because you can run the same dates and amounts through both.
- Treat XIRR figures for periods under a year with caution, since annualising a short period can blow small gains or losses out of proportion.
Pros and cons of each measure
CAGR
- Pro: simple to calculate and easy to compare across funds.
- Pro: the standard way factsheets report trailing returns.
- Con: assumes a single investment, so it misleads for SIPs.
- Con: depends heavily on the start and end dates chosen, and hides the ups and downs in between.
XIRR
- Pro: reflects your actual dates and amounts.
- Pro: works for any mix of purchases and withdrawals, including a systematic withdrawal plan.
- Con: needs exact dates and amounts for every transaction.
- Con: still one number, so it hides the path, and it can swing sharply in the first months of a SIP.
Common mistakes when reading XIRR vs CAGR
- Comparing your SIP’s XIRR with a fund’s three-year CAGR from the factsheet. The two use different cash flows, so the gap does not tell you whether you did better or worse.
- Reading absolute return as if it were a yearly figure.
- Worrying about a negative XIRR in the first few months of a SIP. Early figures are noisy, and they settle as the holding period grows.
- Leaving out exit loads and taxes on redeemed holdings. For an honest figure, use the amount you actually received.
Costs matter here too. A higher expense ratio is already inside the NAV, so it quietly lowers both your XIRR and the fund’s CAGR.
How we measure success
A return figure is only useful if it helps you make a decision. Here is the framework we suggest for tracking whether a SIP is on course. It uses no fixed target number, because the right number depends on your fund category and your goal.
- Right measure: XIRR for every SIP holding, recalculated with your actual dates and amounts.
- Benchmark check: run the same dates and amounts through the fund’s benchmark index, or an index fund, and compare the two XIRRs. This isolates what the fund manager added.
- Goal check: compare your XIRR with the return your goal plan assumed. If it lags for several years, revisit the amount or the time frame as well as the fund.
- Review rhythm: look once a year, not every day. Judge an equity fund over a full market cycle.
- Net of costs: use values after exit load and tax whenever you redeem.
Frequently asked questions
Is XIRR better than CAGR?
Neither is better in general. They measure different things. For a SIP or any investment with several cash flows, XIRR is the right measure. For a single lump sum, the two give the same answer.
Why is my SIP XIRR different from the fund’s CAGR?
Your instalments went in on different dates from the factsheet’s single start date. So, if the market rose soon after your later instalments, your XIRR can be higher than the fund’s CAGR, and the reverse is also possible.
Can XIRR be negative?
Yes. If the current value is below what you invested, after accounting for timing, XIRR will be negative. This is common in the early months of a SIP or after a market fall.
What is a good XIRR for a mutual fund SIP?
It depends on the fund category and the period. Rather than chase a fixed number, compare your XIRR with the benchmark using the same dates and amounts. That tells you whether the fund did its job.
How do I calculate XIRR in Excel?
List each transaction date and amount, with investments as negative numbers and the current value as positive. Then use =XIRR(amounts, dates). Google Sheets uses the same formula.
Does XIRR include dividends?
In a growth option, gains stay inside the NAV, so XIRR captures them automatically. In an IDCW option, add each payout as a positive cash flow on the date you received it.
Why does the XIRR on my statement change every day?
The current value of your holding moves with the daily NAV. Since that value is the final cash flow in the calculation, XIRR changes with it.
See all your SIPs in one place. Invesaur brings your mutual funds, SIPs, goals and portfolio tracking together, so you can follow how your money is doing over time without juggling spreadsheets.
Mutual fund investments are subject to market risks. Read all scheme-related documents carefully.